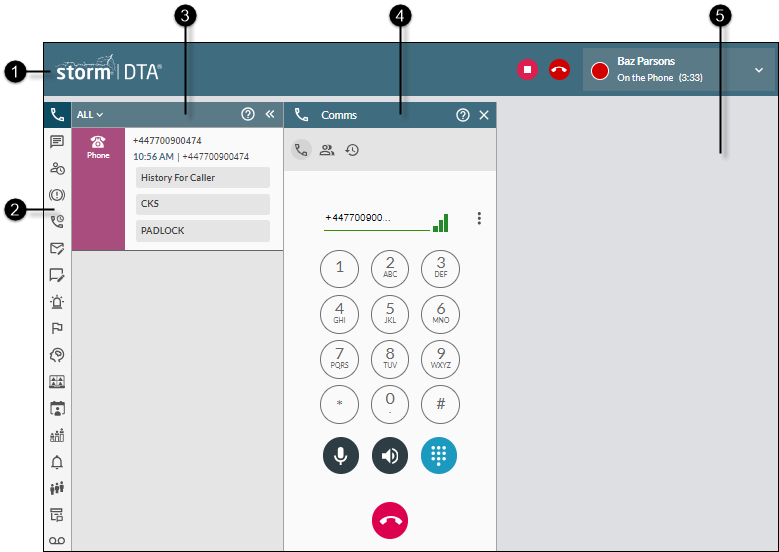
Main Application Window
Note: an organisation can be configured to ignore F5 key presses in Chrome, Firefox and IE browsers. This prevents the user from being logged out of DTA when they mistakenly press the F5 key. The DTA can be configured to ignore F5 key presses in the following browsers on Windows 10: Chrome, Firefox, and Edge.
|
|
|
|
|
|
|
|
|
|
|
|
|
|
|
|
|
|
|
|
|
|
|


Main Title Bar
|
|
|
|
|
|
|
|
|
|
|

Call-Handling Panel
|
|
Answer Machine button (displayed during OUTBOUND dial calls only) Clicking this ends the call that is in progress, submits a preconfigured completion code, and places the dialler agent into the Available status in readiness for the next OUTBOUND call. Dialler agents are expected to use this when OUTBOUND calls are answered automatically by either an answering machine or a voicemail service. |
|
|
Record button - This button is configured to stop and start recordings, or to pause and resume recordings as configured by your administrator. Hover the mouse cursor over the button to find out how the button is configured. If you are on an internal call, your recording actions do not affect the other storm user's recordings. Clicking Clicking
Note: if the button is configured to stop and start recordings, a recording item is generated in the Comms Panel - History Tab each time you stop a recording. |
|
|
Hang Up button - Clicking this ends the call that is in progress, rejects an incoming call, or cancels a call that is being dialled. |
|
|
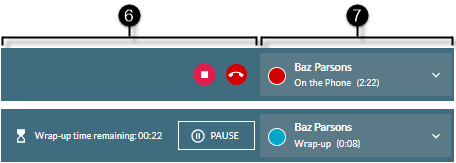
Wrap-up Countdown Timer - Where configured against your organisation, or a queue, or an agent group, this is displayed during the Wrap-up session at the end of a call and indicates the duration for which you will remain in Wrap-up. When the timer expires at the end of the session, you will be moved to 'Available' or to a pre-selected next status. You can click the Note: if the Wrap Panel is displayed during the Wrap-up status, then your completion code submission will either stop the timer, or allow it to run to expiration depending on how your system is configured. In either case, you will be moved to 'Available' or to a pre-selected next status. If you have not submitted a completion code on timer expiry, the Wrap panel will close with no completion code submission. |


 PAUSE button if you want to stop the timer and remain in the Wrap-up status until you exit it manually by either clicking the Complete Wrap-Up button that is displayed, or by selecting another status directly. Clicking the button moves you to 'Available' or to a pre-selected next status.
Availability Status Panel
Displays your storm name and availability status. You may see any of the following colour-coded statuses. A timer may also be displayed indicating your duration in the displayed status.
Standard statuses
There are five standard (system-defined) statuses for you to select by clicking on this panel and then selecting the status from the dropdown menu.
|
|
Available - (Green) You are available to receive any call or interaction. |
|
|
Available (Internal Only) - (Navy blue) You are available to receive internal calls only. You will NOT receive any calls that are routed through queues. |
|
|
Available (Direct Only) - (Mid blue) You are available to receive direct calls only. You will NOT receive any calls that are routed through queues. |
|
|
Unavailable - (Mid grey) Calls will NOT be routed to you. |
|
|
Wrap-up - (Turqoise) You are in the wrap-up status and calls will NOT be routed to you. You normally enter this status automatically at the end of an interaction. You may also be able to switch to it manually by clicking on this panel and then selecting it from the status list. |


Custom statuses
In addition to the standard statuses, your administrator may have configured a number of custom statuses for you to select from the dropdown menu. The colour of a custom status indicates the standard status upon which the custom status is based.
Note: selecting a green or blue coloured custom status does not necessarily mean that queued calls will be routed to you; similarly, selecting a mid-grey coloured custom status will not necessarily prevent calls from being routed to you. The routing behaviour of custom statuses is configured by your storm administrators or supervisors and you should speak to them to understand their routing behaviour.
See also, Change your Availability Status.
Auto statuses
The following statuses are displayed automatically when appropriate:
|
|
Logged Off - (Dark grey) Your telephone device is not active and therefore you cannot initiate and receive any calls or interactions. See Activate Your Telephone Device. |
|
|
Setup - (Amber) Your phone is ringing or you are dialling out. |
|
|
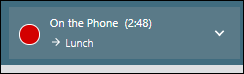
Engaged - (Red) You are engaged in a call or an interaction. The wording of the status depends on the active communication channel. For example, 'On the Phone' is displayed for an incoming voice call. During a call, any other status within the call is also shown. For example, 'In Consultation' is displayed when you are speaking to a third party during a warm transfer, and 'In Conference' is displayed when you are engaged in a three- or four-way conference. |


A status shown next to the ![]() symbol is the status that you have selected whilst on a call or in the Wrap-up status. It indicates that you will switch to this pre-selected next status when the call ends.
symbol is the status that you have selected whilst on a call or in the Wrap-up status. It indicates that you will switch to this pre-selected next status when the call ends.
Clicking on the panel also allows you to Log out of DTA.
Toolbar
This provides access to the following basic functions that you can use at any time.
|
|
Toggles the display of the Comms Panel. |
|
|
Launches this Help in a separate window. |


The following buttons may also be displayed for optional functions:
|
|
Toggles the display of the Emergency Alert panel. Use the panel to send an emergency alert message to an agent group. |
|
|
Toggles the display of the Alert Supervisor panel. Use the panel to request immediate help or support from your supervisor. |
|
|
Toggles the display of the Chat Panel. Use the panel to chat to users in your organisation. A number on the button indicates the number of users or chat groups whose messages you have not read. |
|
|
Toggles the display of the Scheduled Callbacks Panel. Use the panel to see which dial contacts you are scheduled to call back in the current storm OUTBOUND campaign. |
|
|
Toggles the display of the Activity Log Panel. Use the panel to see a breakdown of your personal activity on any day in the rolling seven-day period, and to see a set of real-time statistics for all agent groups of which you are a member. If you do not have the user right to see the activity log, then the Get Statistics Panel is displayed instead. |
|
|
Launches the New Email Panel. Use the panel to initiate a new outgoing email. This button greys out when you are composing an email (as indicated in the Interactions Panel). |
|
|
Launches the Follow up Emails Panel. Use the panel to follow up on emails that have been marked for follow up by any agent in an agent group of which you are a member. |
|
|
Launches the SMS - Compose Panel. Use the panel to initiate a new outgoing SMS text message. This button greys out when you are composing a message (as indicated in the Interactions Panel). |
|
|
Launches the Cobrowse Panel. Use the panel to initiate a cobrowsing session with a customer. |
|
|
(Supervisors only) Toggles the display of the Monitor Agents Panel. Use the panel to see the availability statuses of your agents and to perform agent monitoring tasks. |
|
|
Toggles the display of the My Queues Panel. Use the panel to see today's real-time statistics for queues and queue groups that are serviced by agents groups of which you are a member. |
|
|
Toggles the display of the Notification Centre Panel. If you are an agent, use the panel to see notifications that are being broadcast by supervisors. If you are a supervisor, use the panel to see alert messages sent by your supervised agents. A number on the button indicates the number of notifications that you have not acknowledged. |
|
|
Toggles the display of the Voicemail Panel. Use the panel to listen to your personal voicemail messages. A number on the button indicates the number of voicemail messages that you have not acknowledged. |
|
|
Toggle the display of the Unprocessed Messages Panel. Use the panel to view and handle unprocessed messages. |
|
|
Toggles the display of the Quality Report Panel. Use the panel to submit a quality report about a DTA issue you have experienced. |
|
|
Toggles the display of the Refund Panel. Use the panel to see historical storm LOCK and PADLOCK payment transactions in your organisation, and, where permitted, to issue full and partial refunds for any of those transactions. |
|
|
(Supervisors only) Toggles the display of the Broadcast Panel. Use the panel to broadcast a message to the agent groups that you supervise. |
|
|
(Supervisors only) Launches storm RECORDER, the omnichannel recording application that records every communication channel that your employees use. |
|
|
(Supervisors only) Launches storm VIEW, the reporting application that empowers supervisors to perform day-to-day monitoring activities on real-time and historical reporting dashboards. |
|
|
(Supervisors only) Launches storm WFM, the omnichannel forecasting and scheduling solution, offering powerful, native Workforce Management functionality. |
|
|
(Supervisors only) Launches storm CONDUCTOR, the workflow design tool for building a storm contact centre. |
|
|
Launches the storm CKS integration for DTA, an intuitive online portal for agents who need to handle calls and interactions while maintaining customer records. |
|
|
(Switchboard operators only) Launches the Web Switchboard Panel. storm SWITCHBOARD™ is an integrated application allowing switchboard operators to claim entrants from queues that serve as general waiting areas for a site or department, or as overflow areas for entrants who have been waiting too long to speak to an agent. |
|
|
(Switchboard operators only) Launches the Queue Selection Panel to allow operators to set up their switchboard display. |
|
|
(Switchboard operators only) Launches the Queue Summary Panel to allow operators to monitor activity in their switchboard queues. |
|
|
Displays the Settings Window. Use this to change your DTA settings. Supervisors can also manage users from here. |
|
|
Allows you to rearrange the toolbar buttons by click and drag. |


A colour-highlight on a toolbar button that opens a panel indicates the following.
 |
A dark highlight indicates a panel that is on display in the workspace whilst a lighter highlight indicates a panel that is minimised. Clicking the button of a minimised panel displays the panel in the workspace; clicking the button of a displayed panel minimises or closes the panel (depending on the type of panel). |
Interactions Panel
The Interactions Panel displays details of the interaction you are engaged in. If you have multiple interactions in progress at the same time, you can use this panel to switch between them.
Click  to hide the panel.
Comms Panel
Provides access to the following tabs:
|
|
Displays the Phone Tab. Use this tab to make, receive, and handle calls. |
|
|
Subject to user rights. Displays the Phonebook/Contacts Tab Contacts Tab. Use this tab to see storm users, treatments (queues and hunt groups), external contacts, and your personal contacts. You can click on contacts to call them. |
|
|
Subject to user rights. Displays the History Tab. Use this to see every call that you have made and received. |


Clicking  in the panel's title bar displays Help content for the displayed tab.
Note: in some deployments, the tabbed Comms Panel is not available. Instead, the phone, contacts and history are provided in standalone panels, accessible from the toolbar. If you prefer this setup, consult your local support desk.
Workspace
Displays panels launched by the toolbar or by an interaction. As a visual aid, the title bar of each panel is coloured — the colour is determined by the successive placement of the panel in the workspace rather than its type. For example, if you are handling two successive Email interactions, the title bar colour of the Email panels associated with the second interaction will be different to that of the first.
In some DTA deployments, one or more web pages may be displayed in custom panels as configured by your storm administrator. This provides access to content (such as third-party websites) outside the workflow of interactions.
The section DTA Panels Reference provides detailed information about the main panels in the DTA application.
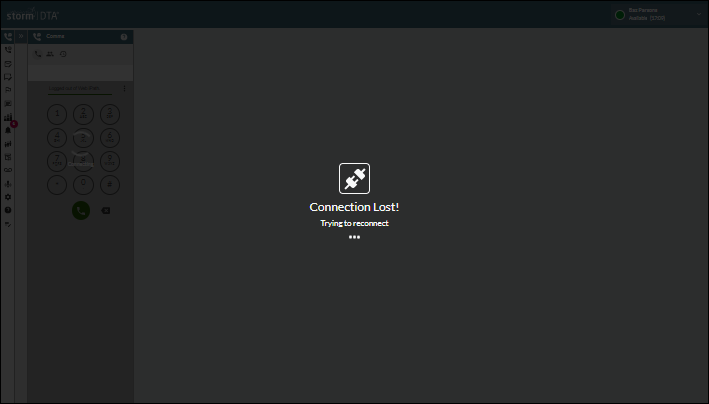
Loss of Connection
If there is a temporary loss of connection between DTA and the storm servers, the main application window is greyed out and a 'Connection Lost!' message displayed.