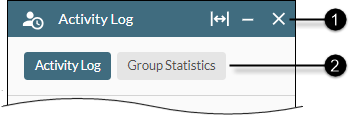
Activity Log Panel
This is accessed by clicking the ![]() button on the Toolbar.
button on the Toolbar.
Use this panel to see a breakdown of your personal activity on any day in the rolling seven-day period and to see real-time statistics for the agent groups of which you are a member.
You can operate this panel by using your mouse or keyboard (see Accessibility Features).
|
|
|
|
|
||||||||
|
|
|
Panel control buttons |
|
||||||||
|
|
|
Tabs |
These are shown only if you have the user rights to see both the activity log and group statistics.
|
||||||||


 Activity Log button on the

Activity Log Tab
|
|
|
|
|
|
|
|
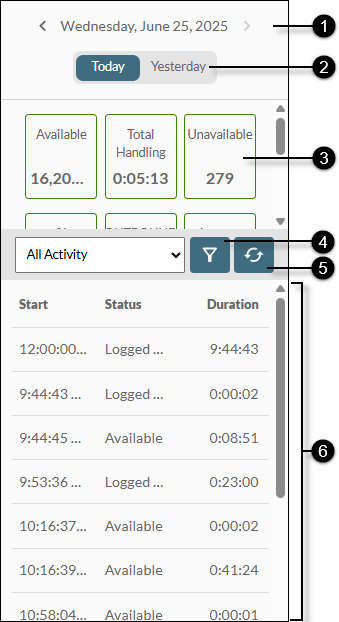
Activity Date |
Displays the date for which the panel is displaying statistics. Click the |
|
|
|
Today/Yesterday buttons |
Click these to display statistics for today or yesterday. |
|
|
|
Statistics |
Displays your availability and interaction-handling statistics for the selected day. Today's statistics are outlined in green whilst statistics for other days are outlined in grey. The statistics that you see here are configured by your storm administrator. |
|
|
|
Filter button |
Allows you to filter the Status Duration list (below). Note: you cannot filter on custom user statuses. |
|
|
|
Refresh button |
(Today's statistics only) Updates the panel to display today's latest real-time statistics. |
|
|
|
Status Durations |
The list of statuses that you entered into on the selected day. The time when you entered each status and your duration in each is also displayed. |
 and
and  buttons to display statistics for another day in the rolling seven-day period.


Note: administrators and supervisors should note that the format of the displayed statistics is the same as that presented for those statistics in the underlying historical reports in storm VIEW except where the format in VIEW is in minutes. In this case, the Activity Log panel/tab presents the format in ‘hours’. For example, ‘90 minutes’ in VIEW is presented as ‘01:30’ in DTA.
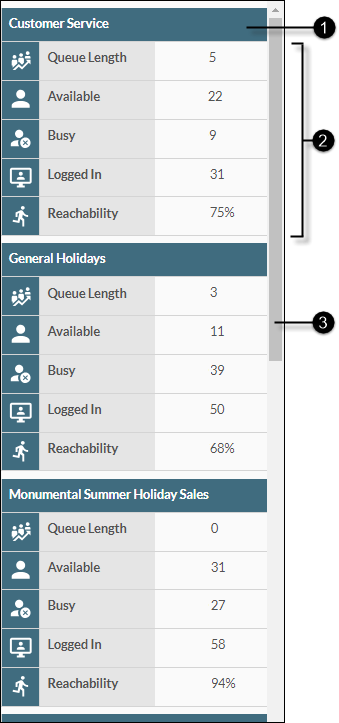
Group Statistics Tab
In Single-Width View
|
|
|
|
|
||||||||||||||||||||
|
|
|
Agent Group |
The name of the agent group. The panel displays statistics for all agent groups of which you are a member. |
||||||||||||||||||||
|
|
|
Statistics |
The statistics for each agent group. These have the following meanings:
A '?' symbol in place of a value indicates that the value for that statistic is currently unknown or cannot be calculated. |
||||||||||||||||||||
|
|
|
Scroll bar |
Up to three agent groups are displayed at a time. Use the scroll bar to see statistics for other agent groups. |
||||||||||||||||||||
 Queue Length
 Available
 Busy
Busy Logged In
 Reachability
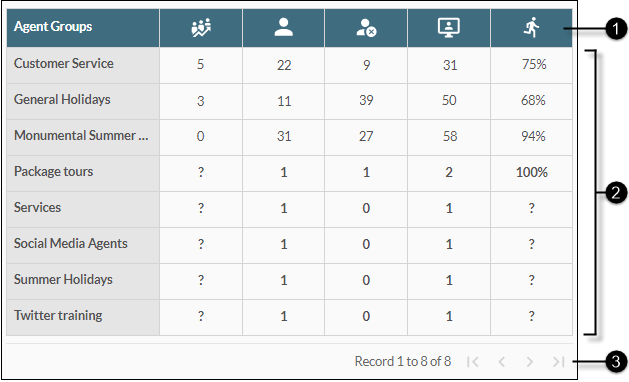
In Double and Maximum-Width Views
|
|
|
|
|
||||||||
|
|
|
Statistics column headings |
See the 'Statistics' section of the single-width view above for the meanings of the icons in the column headings. |
||||||||
|
|
|
Statistics grid |
The statistics for each agent group of which you are a member. A '?' symbol in place of a value indicates that the value for that statistic is currently unknown or cannot be calculated. |
||||||||
|
|
|
Pagination buttons |
Indicates the number of agent groups that are currently in view and the total number of agent groups. The number of agent groups displayed per page depends on your screen size and zoom level, with a maximum of 20 agent groups displayed per page. Use the arrow buttons to see agent groups that are not currently visible in the panel.
|

