My Queues Panel
This is accessed by clicking the  button on the Toolbar.
Use this panel to see today's real-time statistics for queues and queue groups that are serviced by agents groups of which you are a member.
You can operate this panel by using your mouse or keyboard (see Accessibility Features).
|
|
|
|
|
||||||||||||||||||||||||||||||||||||||||||||||||
|
|
|
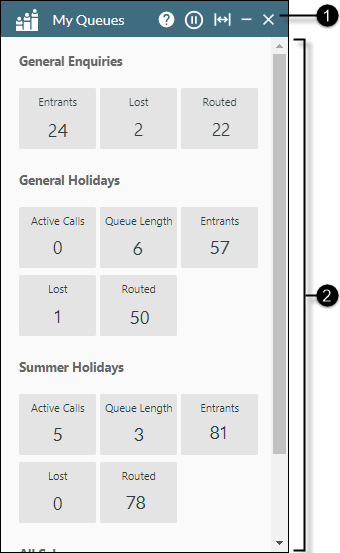
Panel help and control buttons |
|
||||||||||||||||||||||||||||||||||||||||||||||||
|
|
|
Statistics Display Area |
Displays real-time statistics for every queue and queue group item that is serviced by the agent groups of which you are a member. The queue items are listed in alphabetical order and have the following meanings:
A vertical scroll bar appears when there is not enough vertical space in the panel to display all of your queue statistics. The statistics for each queue and queue group are configured by your storm administrator whom you should consult for further information. |
||||||||||||||||||||||||||||||||||||||||||||||||


 button resumes the animation.


See Also
See also, See Queue Statistics.