The VIEW Dashboard Interface
There are two types of VIEW dashboard: real-time statistics dashboards and historical report dashboards and there can be any number of each. Every dashboard is identified by a name, which appears on its tab at the top of the dashboard. You display a dashboard by clicking its tab.
Real-Time Statistics Dashboards
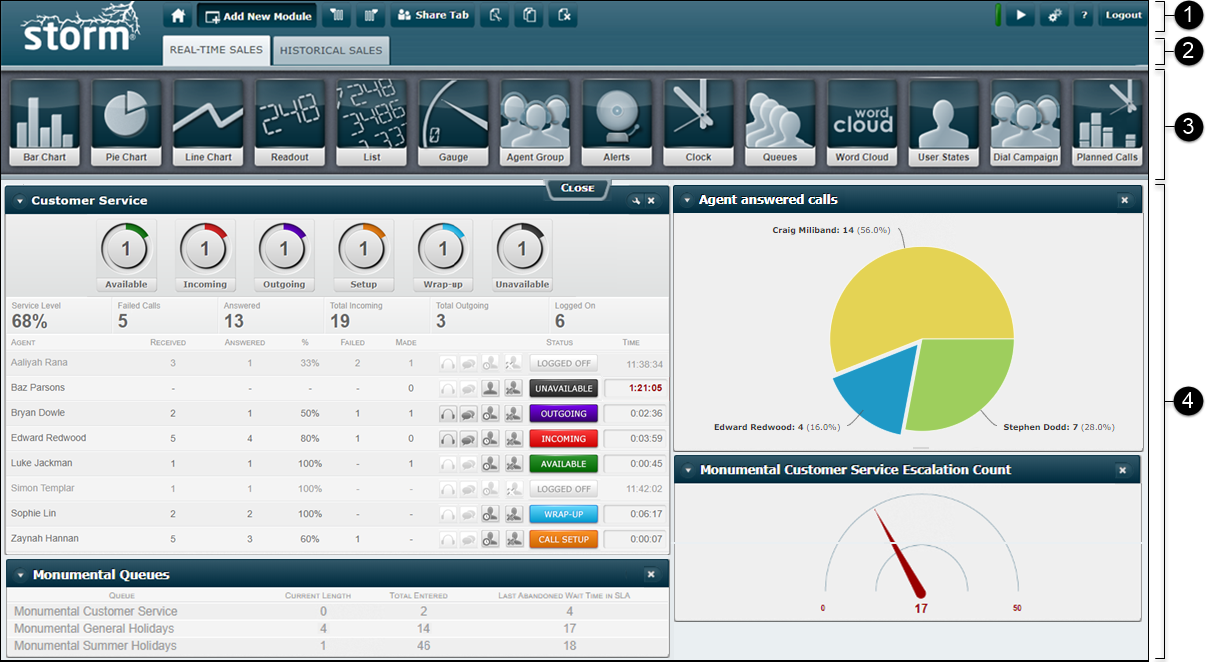
Shown below is a real-time statistics dashboard called 'Real-Time Sales', which is populated with a selection of real-time modules. See Real-Time Module Descriptions.
Historical Report Dashboards
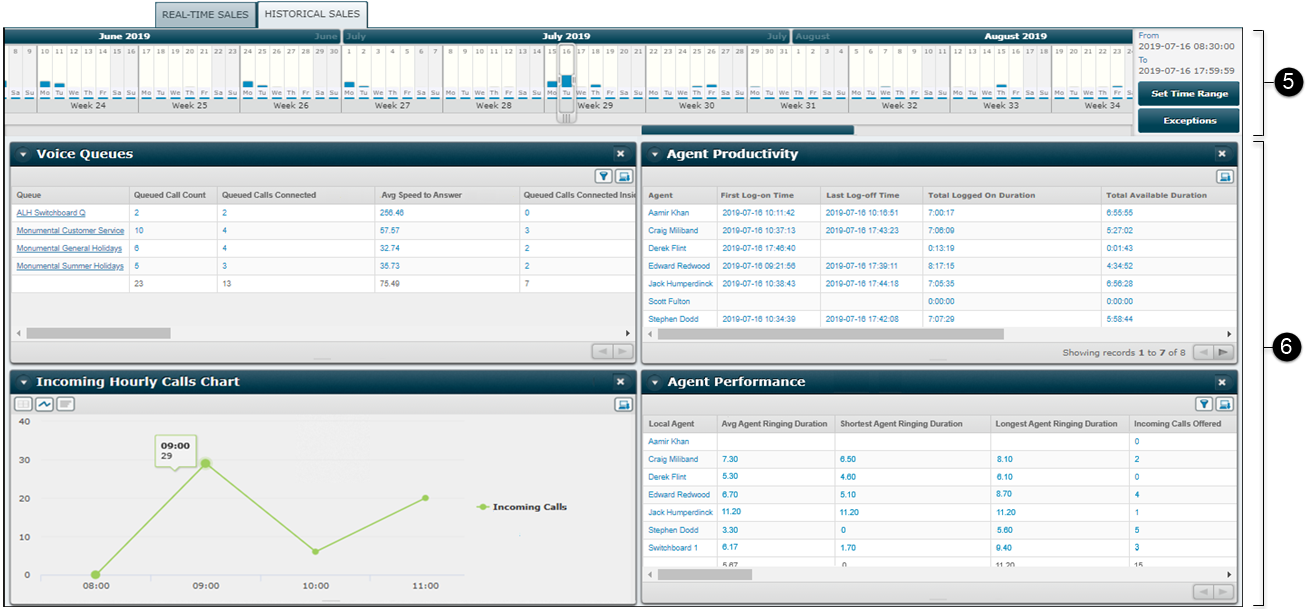
This is a historical dashboard called 'Historical Sales', which is populated with a selection of historical reports. These can be out-of-the box standard historical reports or reports created by your administrators. The standard historical reports are documented in the storm VIEW Standard Historical Reports Reference Guide.
|
|
|
|
 |
Button bar |
For accessing VIEW functions. See Button Bar. |
|
Dashboard tabs |
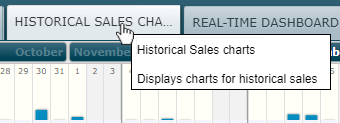
The real-time statistics and historical report dashboards that you have created or have been shared with you by other users. Clicking a tab displays the dashboard. Hovering over a tab name provides a description of the dashboard (if set):
A For example, |
|
 |
Module palette |
(Administrators only) For accessing real-time module types to include on the dashboard. |
|
Real-time modules |
(Real-time statistics dashboard only) Real-time statistics modules as configured by administrators. |
|
|
(Historical report dashboard only) For selecting a reporting date and time range. The data is shown upon selection. The selector is for defining a date range:
See also, Run Historical Reports. |
||
|
Historical reports |
Historical reports created by administrators in the VIEW Report Builder. |
 icon next to a name indicates that the dashboard is being shared by other users.
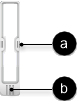
Button Bar
|
Item |
Description |
||||||
|
|
Contents Page button (all users) Displays a list of real-time statistics and historical report dashboards that you have created or have been shared with you by other users. |
||||||
|
|
Add New Module button (administrators) Toggles the display of the module palette. (The button is shown when a real-time dashboard is displayed.) See also, Place Real-Time Modules on a Dashboard. |
||||||
|
|
Add Report button (administrators) Displays a list of standard and custom historical reports for adding to the dashboard. (The button is shown when a historical dashboard is displayed.) See also, Place Historical Reports on a Dashboard. |
||||||
|
|
Insert Column buttons (administrators) Inserts additional columns to the left and right of the existing dashboard columns. See also, Change a Dashboard's Properties and Layout. |
||||||
|
|
Share Tab button (all users) Allows you to share the displayed tab with other supervisors and administrators. See also, Share a Dashboard With Other Users. |
||||||
|
|
Edit Dashboard button (administrators) Allows you to edit the name and description of the displayed dashboard's tab. See also, Change a Dashboard's Properties and Layout. |
||||||
|
|
Clone Dashboard button (administrators) Makes an exact copy of the selected dashboard. See also, Copy a Dashboard and its Contents. |
||||||
|
|
Delete Dashboard button (administrators) Deletes the selected dashboard. |
||||||
|
|
Filter Reports button (administrators) Displays a dashboard-level filter ribbon allowing you to apply one or more filters that apply to all reports on the dashboard. (The button is shown when a historical dashboard is displayed.) See also, Apply a global filter to a historical reports dashboard. |
||||||
|
|
Real-time Feed Indicator (all users) A coloured line indicating the status of the browser's connection to the real-time feed. Clicking the indicator displays a textual description.
|
||||||
|
|
Play/Pause Dashboard Rotation buttons (all users) Play and pause dashboard rotation (the buttons are shown if dashboard rotation is configured). See also, Auto-Cycle Dashboards for Wallboard Display. |
||||||
|
|
Settings button (all users) Provides VIEW administration functions. See also, Settings Button, below. |
||||||
|
|
Help button (all users) Displays VIEW help topics. |
||||||
|
|
Logs you out of VIEW. |

Settings Button
|
Setting |
Relates to |
Description |
|
Report Builder |
Historical reporting |
(Administrators) Opens the Report Builder interface for creating historical data exports and custom historical reports. See also, Create a Historical Data Export Report and |
|
Scheduled Reports |
Historical reporting |
(Administrators) For creating regular export schedules for historical reports. See also, Export Historical Reports According to a Schedule. |
|
Alerts |
Real-time reporting |
(Administrators) For configuring on- and off-screen alert messages triggered by real-time activity. See also, Create a Real-Time Message Alert. |
|
Template Reports |
Historical reporting |
(Administrators) For assigning historical reports to sub-organisations. See also, Share Historical Reports With Your Sub-Organisations. |
|
Audit Log |
General administration |
(Administrators) For displaying actions performed by users. See also, Display an Audit Log of VIEW User Actions. |
|
Edit Users |
General administration |
(Administrators) For controlling user access to VIEW features. See also, Control User Access Rights to VIEW Features. |
|
Dashboard Rotation |
Wallboard display |
(All users) For configuring the cyclical display of real-time and historical dashboards on a wallboard. See also, Auto-Cycle Dashboards for Wallboard Display. |
|
Extended Records |
Historical reporting |
(Administrators) For creating custom data export fields populated by storm FLOW scripts. See also, Create an Extended Record. |
|
Template Records |
Historical reporting |
(Administrators) For assigning custom data export fields to sub-organisations. See also, Create an Extended Record. |
|
Queued Reports |
Historical reporting |
(All users) For running complex historical reports as background tasks. See also, Run Historical Reports in the Background. |
|
Real-time reporting |
(Administrators) For integrating real-time statistical data from your third-party tools into VIEW so that data from different sources can be seen in one place. See also, Create Custom Real-Time Events. |
Effect of Access Profiles on Dashboard Statistics
An access profile set up by you or another storm administrator may be used to restrict access to selected historical reports. Such reports will then display an error message instead of data.
Within real-time statistics modules and historical reports, an access profile may also restrict data such as access numbers, agents, agent groups, FLOW scripts, and telephone extensions.
For example, consider a report that displays agents and a metric for the number of agents included in the group. For a supervisor or administrator who is restricted to seeing only some of the agents in the group, the count metric will include all agents in the group but the statistics for the individual agents will be hidden.
Note: see the storm STUDIO User Guide for information about access profiles and what they can restrict.