Create a Custom Historical Report
This is a procedural topic for administrators describing how to create a custom historical report.
This topic also covers the following related tasks:
Add Report Filters to a Custom Report
Change a Metric's or Dimension's Display Name
Configure a Custom Report's Dashboard Display Options
Configure Display Options (For Use in Scheduled Exports)
Delete a Custom Historical Report
Prerequisites
- You have logged in to storm with your user log in credentials and then launched the VIEW application. See Log in to storm and Launch VIEW.
- You are familiar with the VIEW Dashboard Interface.
- You are familiar with the historical data sources. See Historical data sources.
- You are familiar with the structure of a custom historical report. See Custom reports.
- You have read the sections Custom Historical Report Design Strategy and Adding a dimensioning to a custom historical report.
Configuration
-
Click
 in the top-right of the VIEW window and then select Report Builder. This displays the Report Builder interface for custom historical reports.
-
Select Custom Report from the Report Type selector.
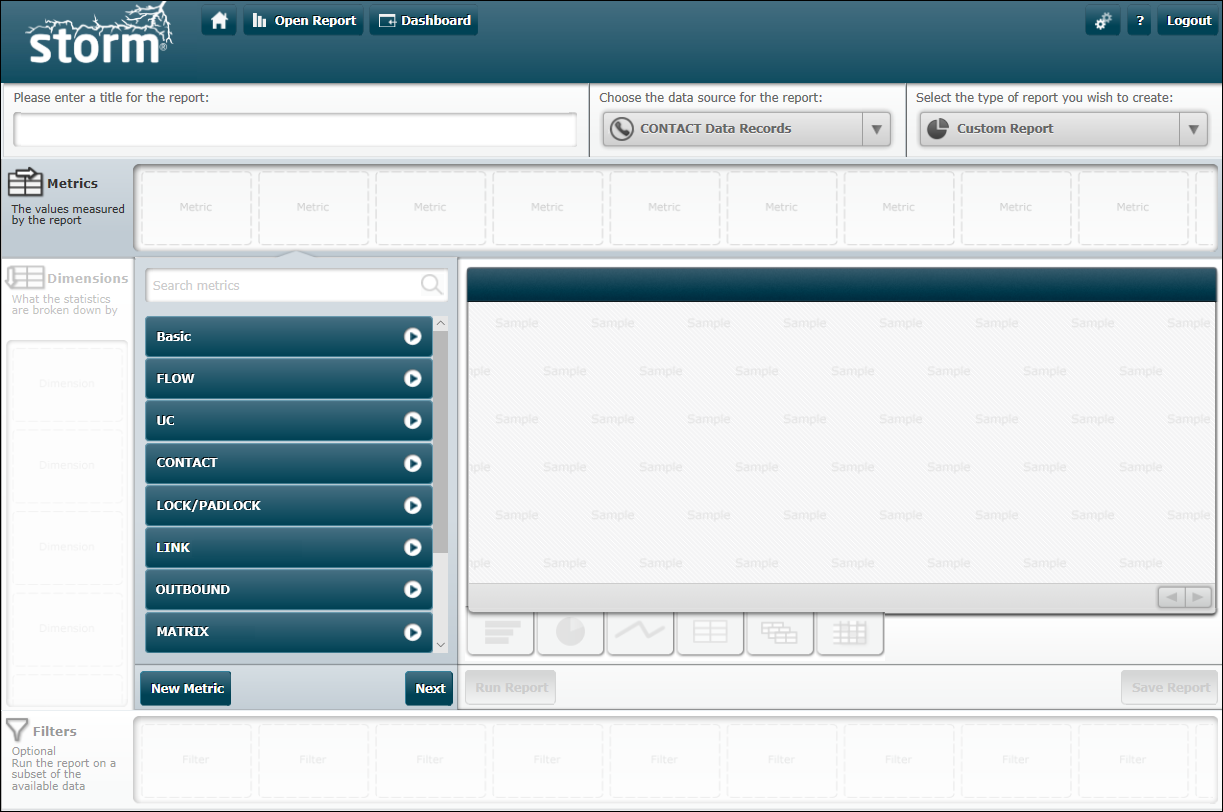
For details about this screen, see Report Builder interface for custom historical reports.
-
Select the desired historical data source from the Historical Data Source selector.
-
Ensure that the Metrics ribbon is active (it will highlight in grey). It if is not, click it. This displays the Metric Selector panel below the ribbon.
-
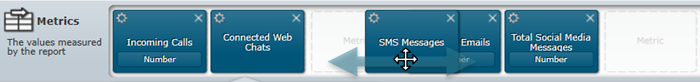
In the Metric Selector panel, select a metric to include in your report. If you know the full or partial name of the metric, use the Search export field field at the top of the panel to locate it quickly.
A  means that the metric is included in the report. It appears in the Metrics ribbon as well as in the Preview panel. The values shown in this panel are dummy data and will be replaced with real values when you run the report later.
-
Add further metrics as required. You can change the sequential order of a metric by dragging and dropping it to another location on the Fields ribbon.
-
Click the Dimensions ribbon (it will highlight in grey). This switches the Metric Selector panel to the Dimension Selector panel.
-
From the Dimension Selector panel, select a dimension to include in your report.
-
Add further dimensions as required. As with a metric, you can change the sequential order of a dimension by dragging and dropping it to another location on the Dimensions ribbon.
-
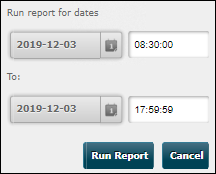
Click Run Report and then use the controls in the displayed dialog to define date and time range for which communication data is present in the historical data source:
-
Click Run Report and observe the data output in the Preview panel.
-
When you are satisfied with the report's design and wish to keep it for further use or for inclusion on a historical dashboard, enter a unique name for the report in the Report Name field and then click Save Report.
The report can now be added to a dashboard.
Related Tasks
Add Report Filters to a Custom Report
See Filters in a Custom Historical Report.
-
Click the Filters ribbon (it will highlight in grey). This switches the Metric or Dimension Selector panel to the Filter Selector panel.
-
In the Filter Selector panel, select a filter to include in your report. If you know the full or partial name of the filter, use the Search filters field at the top of the panel to locate it quickly.
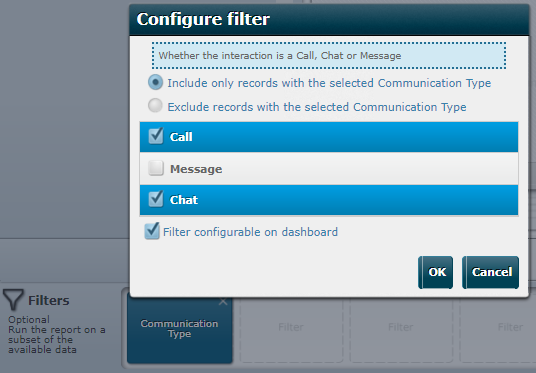
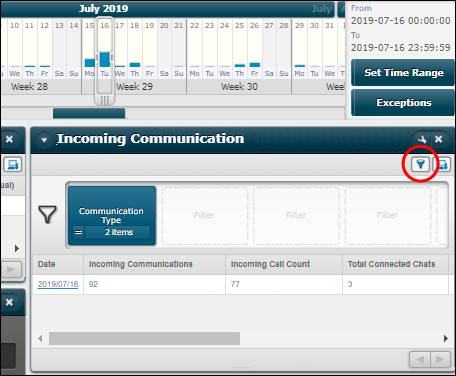
The filter appears in the Filters ribbon and a filter configuration dialog is displayed:
-
Configure the filter by typing or selecting the desired values. Filter options vary according to the type of filter. Show above are the options for the 'Communication Type' filter.
Select the Filter Configurable on Dashboard option only if you want the filter to be available to users when the report is added to a dashboard.
-
Click OK.
-
Add further filters as necessary.
-
Re-run the report to see the effect of the filters.
-
Save the report.
Configure a Metric or Dimension
|
Task |
Procedure |
|
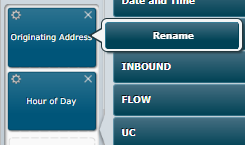
This is useful if you want to present an alternative name to dashboard viewers. The display name does not affect the metric's or dimension's given name. In the Metrics or Dimensions ribbon, click the metric's or dimension's |
|
|
See Filters in a custom historical report for information about metric filters. In the Metrics ribbon, click the metric's In the dialog, select the Enable Metric Filter check box and then set the filter.
|
|
|
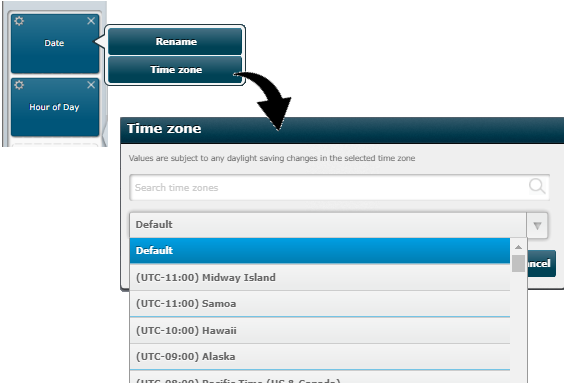
If your report uses date and time dimensions and is to be run in a time zone that is outside your storm platform's time zone (the default), you should assign your local time zone to each date and time dimension in the report. In the Dimensions ribbon, click the dimension's
Select the time zone and then click OK. The |
 button and then select
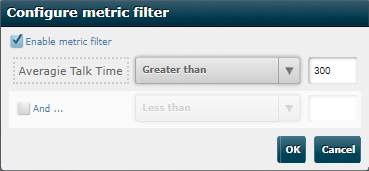
Configure a Custom Report's Dashboard Display Options
See Effect of Custom Report Design on Display Options.
-
In the Metric, Dimension, or Filter Selector panel, click the Next button repeatedly until you arrive at the last panel.
-
In the display modes section, select the report's supported formats that you want to be available to users when the report is added to a dashboard:
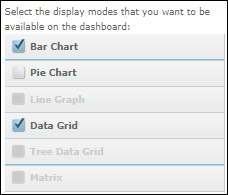
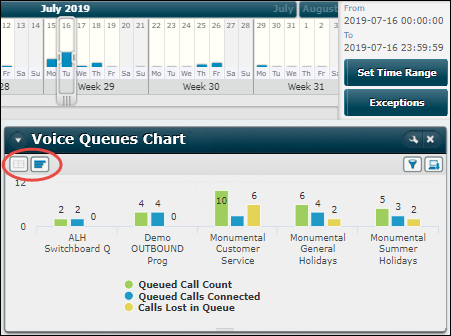
When the report is run on the dashboard, the formats selected here are made available to the report user as highlighted below:
Configure Display Options (For Use in Scheduled Exports)
You can configure how a report should display if it is included in a scheduled export. (See Export Historical Reports According to a Schedule.)
-
In the Field or Filter Selector panel, click the Next button repeatedly until you arrive at the last panel.
-
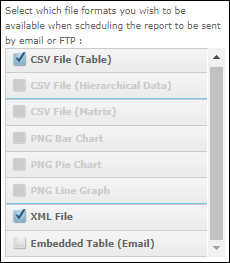
In the scheduled export formats section of the panel, select the formats that should be available for this report when it is included in a scheduled export.
|
Format |
Exports the report... |
|
|
As a comma-separated table with field names as column headings. |
|
|
In XML format. <?xml version="1.0" encoding="utf-8" ?> |
|
|
By embedding it as a text table below the message text in an email. |
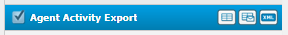
 CSV file (table)
 XML File
 Embedded table (email)
These options are presented to the right of the report name in the Scheduled Export configuration dialog:
-
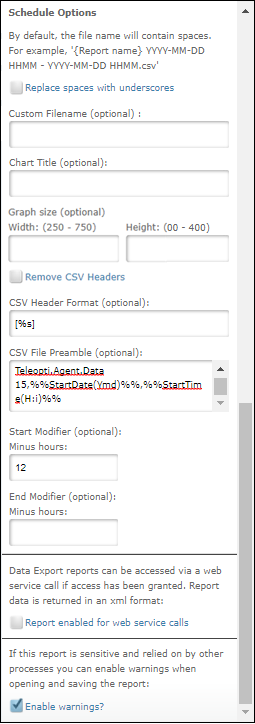
(Optional) Set the options in the Schedule Options section:
|
Field |
What to enter |
|
Replace spaces with underscores |
Select this if, in the default filenames of exported report images and CSV files, you want spaces to be replaced with underscores. (Some target systems may not allow spaces in file names.) |
|
Custom Filename |
If you do not want to use default file names, enter the file name to use for the exported files. |
|
Chart Title |
The title to be displayed on exported graphical images. |
|
Graph Size |
The custom height and width for the exported graphic, in pixels. |
|
Remove CSV Headers |
Select this if you want to exclude the header line from each exported CSV file. (Some target systems do not allow header lines.) |
|
CSV Header Format |
The format of the column headings in a downloaded or exported CSV export. You must include %s as the placeholder for the headings. The effect of the setting as shown in the screen image above is to enclose each column heading with a pair of square brackets. |
|
CSV File Preamble |
Information that should be displayed at the top of a downloaded or exported CSV export. Use any of the following placeholders: %%ReportDateRange()%% %%StartDate()%% %%EndDate()%% %%StartTime()%% %%EndTime()%% You can insert php date format options in the brackets. For example, %%ReportDateRange(Ymd)%%. See http://php.net/manual/en/function.date.php for a full set of options. The effect of the setting in the screen image above is to insert the text 'Teleopti.Agent.Data' followed by the start date and time of the exported report. For example, 'Teleopti.Agent.Data15,20170806,00:00.' |
|
Start Modifier |
An offset (between 1 and 672 hours) by which to bring the start time of a scheduled export forward. As an example, for a report whose next export is for the period 1545-to-1600, specifying an offset of 12 will change this period to 0345-to-1600. |
|
End Modifier |
An offset (between 1 and 672 hours) by which to bring the end time of a scheduled export forward. As an example, for a report whose next export is for the period 0000-to-1200, specifying an offset of 3 will change this period to 0000-to-0900. |
|
Report enabled for web service calls |
This applies to a system that is configured to use the RedViewReportService web service. Select this to enable the web service to request a copy of this report in XML format. |
|
Enable Warnings |
Select this to inform users who open or save this report that the report is sensitive and that they should be cautious of making any changes. An example of a sensitive report is one that is imported by other systems or accessed by web services. These systems or services may expect the report to be in a particular format. |
-
Save the report.
Delete a Custom Historical Report
-
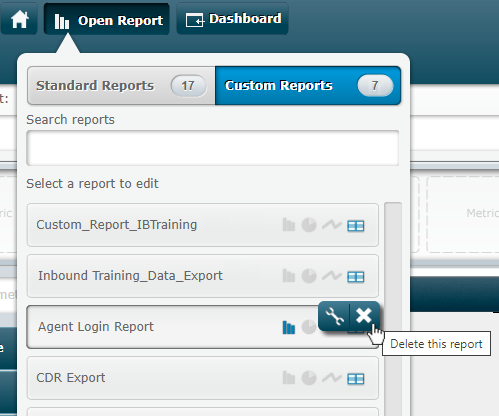
In the Report Builder, click the Open Report button.
-
In the list of reports, hover your mouse cursor over the historical report you wish to delete and then click the
 button to delete the report permanently from VIEW.
 -
Click OK in the confirmation dialog.
Tip: to help you to locate a report in a long list, type the full or partial name of the report in the Search Reports field. For a long report name that is truncated, hover your mouse cursor over the report name to see its full name in a tooltip.
Explore Further
- The library of VIEW standard metrics. See Standard Historical Metrics Reference (in the storm VIEW Historical Data Source Reference Guide).
- Metric Design Strategy. Use this is if you want to design your own metrics.
- The library of VIEW standard dimensions and how they relate to the data export fields. See How a Dimension is Related to a Data Export Field and Dimensions Reference (in the storm VIEW Historical Data Source Reference Guide).
- Appendix B: Best Practice Guidelines for Historical Report Performance