Effect of Custom Report Design on Display Options
Administrators only
The number of metrics and dimensions in a custom report determines the display options that are available to the report.
|
|
Display option |
Applies to reports in this historical data source |
The report may contain |
|
|
Any |
Up to five metrics and one dimension, or One metric and up to two dimensions. |
|
|
|
Any |
One metric and one dimension. |
|
|
|
Any |
Up to five metrics and one continuous (non-discrete) dimension, or One metric and up to two dimensions (the second dimension must be continuous) Examples of discrete dimensions are Agent, and Queue. Most date and time dimensions are continuous. |
|
|
|
Any |
Any number of metrics and dimensions. This is the standard tabular format. |
|
|
|
Contact Data Records |
Any number of metrics and the Organisation Hierarchy dimension. |
|
|
|
Any |
One metric and two dimensions. |


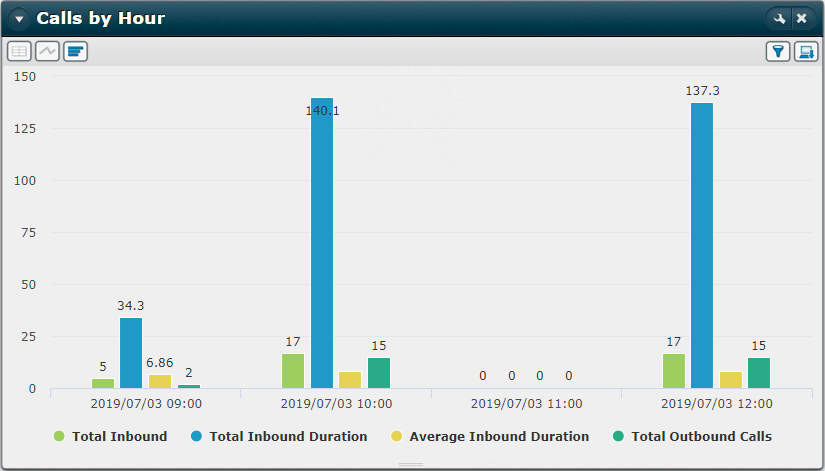
Up to Five Metrics and One Dimension
The height of each bar represents a metric value for a particular dimensional value in your report. In a report containing more than one metric, the metrics (bars) for a dimensional value are grouped together. Shown below is a report where four metrics are broken down by the single dimension of 'Hour'. The report shows four dimensional values of 'Hour' (09:00, 10:00, 11:00, and 12:00).
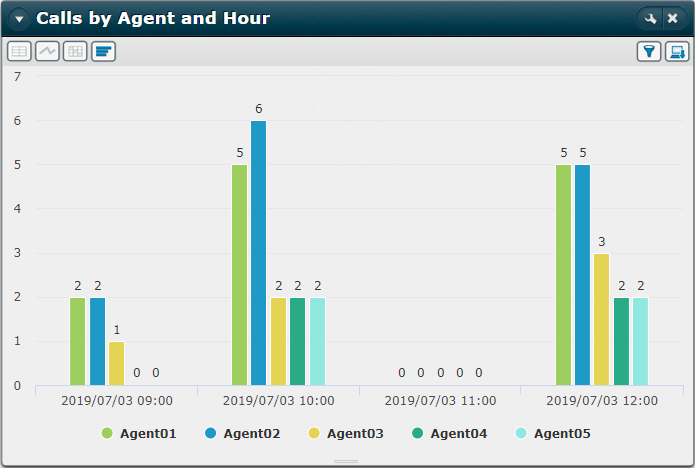
One Metric and Two Dimensions
Each bar shows the metric value down to the level of the second dimension in your report. Each colour represents the report's first dimension and a group of bars represents the dimensional values for the second dimension. Shown below is a report where the metric 'Total Inbound' is broken down by a first dimension of 'Agent' and a second dimension of 'Hour'. The report shows four dimensional values of 'Hour' (09:00, 10:00, 11:00, and 12:00) for the second dimension and five dimensional values of 'Agent' (Agent01, Agent02, Agent03, Agent04, and Agent05) for the first dimension.
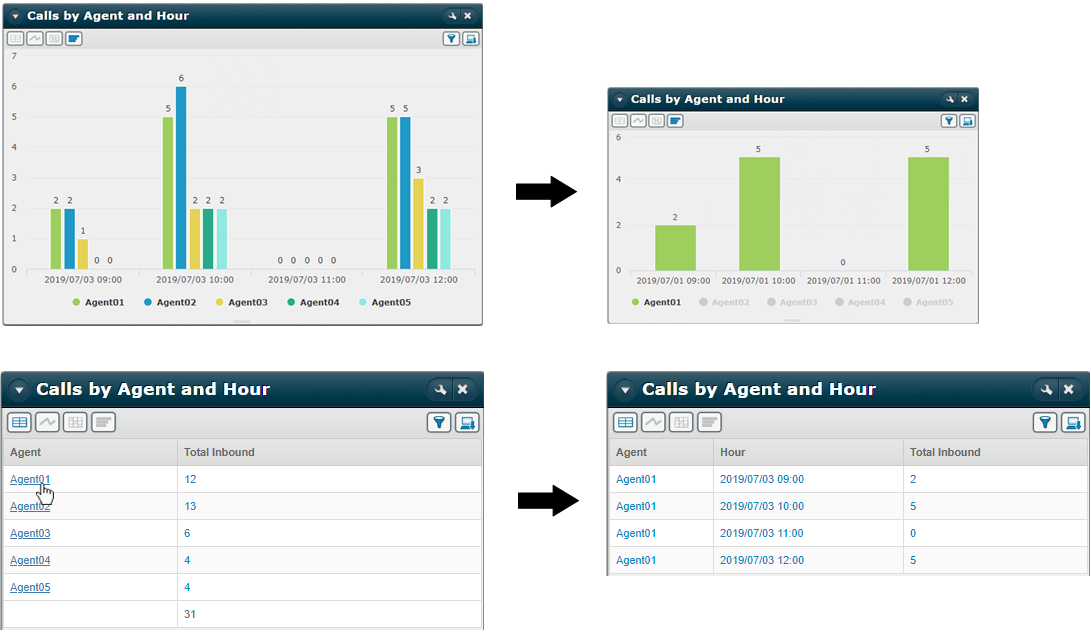
The chart's colour key is for the first dimension and you can click on a key item to toggle the display of that dimension. In the example above, clicking to show Agent01 only is equivalent to clicking the hyperlinked Agent01 dimension in the tabular form of the report as illustrated below:
A maximum of 250 bars can be displayed in Internet Explorer, and 500 in other supported browsers. As an example, if there are 240 agents in a report with one dimension, then Internet Explorer will be able to display a single metric as bars; in other browsers, two metrics can be displayed. To apply limits of other than 250 and 500 for your organisation, contact your local support representative.
This format is used for reports consisting of one metric and one dimension. Each dimensional value is represented as a pie segment, its size indicating its percentage value.
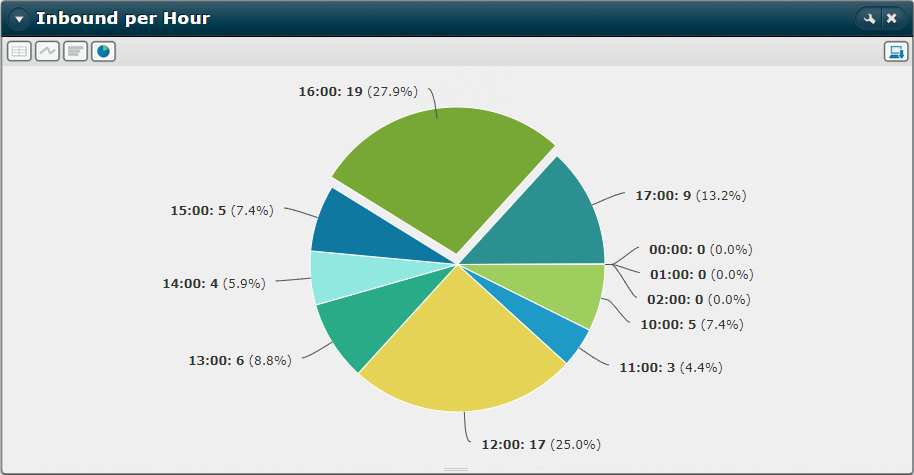
The illustration uses 'Total Inbound' as its metric and shows the percentage of incoming calls received over the selected period.
Where there are more than 55 pie segments, only the 50 largest pie segments are displayed and the remaining data is displayed as a single segment labelled 'Other'. To apply a limit of other than 50 for your organisation, contact your local support representative.
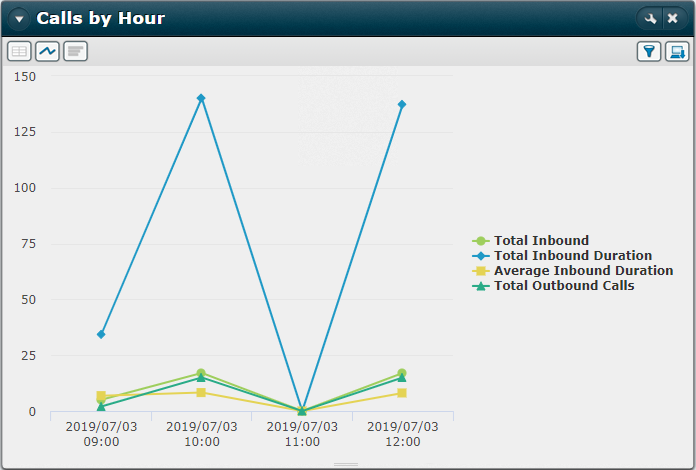
Up to Five Metrics and One Continuous Dimension
Each line graph is a plot of a single metric's values for the single continuous dimension. In a report containing more than one metric, a vertical set of nodes represents the values for all metrics for a dimensional value shown on the horizontal axis (x-axis). Shown below is a report where four metrics are broken down by the single dimension 'Hour'. The report shows four dimensional values of 'Hour' (09:00, 10:00, 11:00, and 12:00).
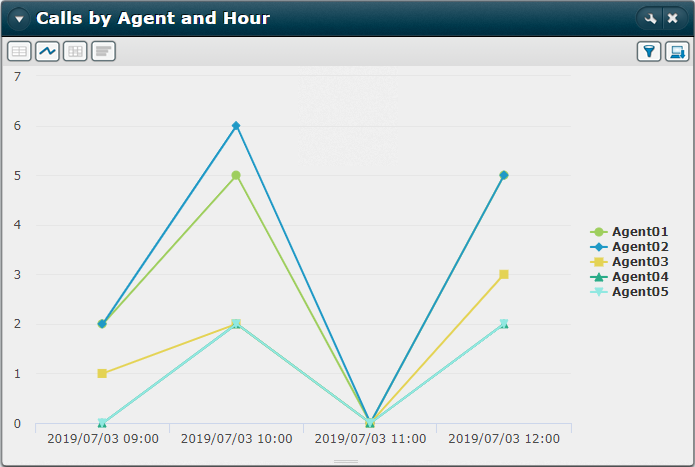
One Metric and Two Dimensions
Each line graph shows the metric's values down to the level of the report's second (continuous) dimension. Each colour-coded line represents the report's first dimensional values and each vertical set of nodes represents the metric values for the report's second dimension. Shown below is a report in which the metric 'Total Inbound' is broken down by a first dimension of 'Agent' and a second dimension of 'Hour'. The report shows four dimensional values of 'Hour' (09:00, 10:00, 11:00, and 12:00) for the second dimension and five dimensional values of 'Agent' (Agent01, Agent02, Agent03, Agent04, and Agent05) for the first dimension.
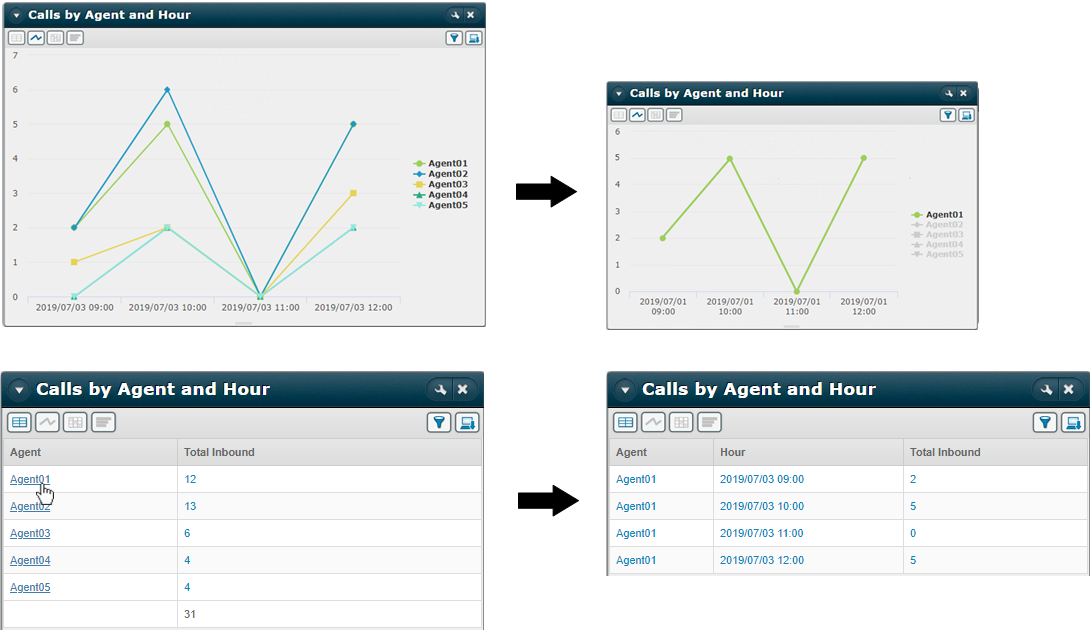
The chart's colour key is for the first dimension and you can click on a key item to toggle the display of that dimension. In the example above, clicking to show Agent01 only is equivalent to clicking the hyperlinked Agent01 dimension in the tabular form of the report as illustrated below:
Each column is a metric, and each row is s dimensional value.
The Tree Grid format presents information broken down by sub-organisation in a hierarchical tree view.
The parent organisation is shown at the top of the list with each sub-organisation indented with a leading hyphen. If a sub-organisation has its own sub-organisations, these are displayed indented with an additional hyphen:
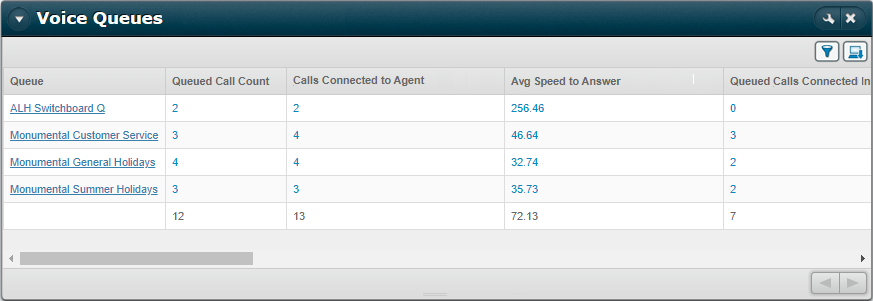
The columns represent the first dimension and the rows the second. The values are for the single metric.
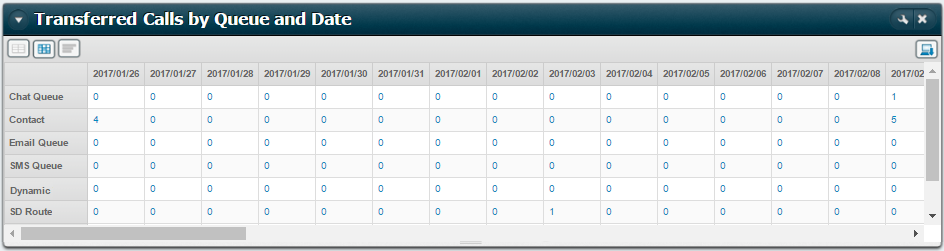
The report illustrated above shows the number of calls transferred for each queue on each day.
See Also