Custom Historical Reports
Administrators only
A custom report shows calculated values (metrics) such as sum totals, averages, highest value, lowest value, and unique value from a set of data export fields and for a user-defined date and time range. For example, you may wish to display the total and average talk time for calls that arrived through a queue.
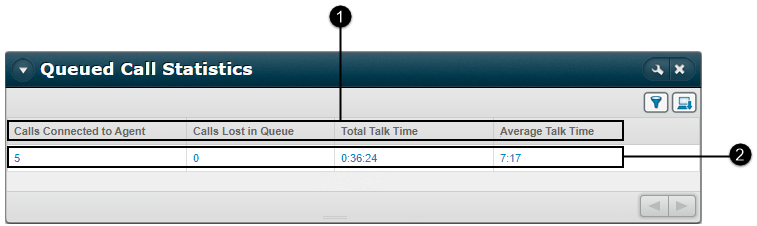
Shown below is the structure of a simple custom report. This particular example is showing calculated talk time values from the CONTACT Actions data source.
|
|
|
 |
A selection of metrics from a historical data source. |
 |
The calculated metric values for the selected date and time range. |

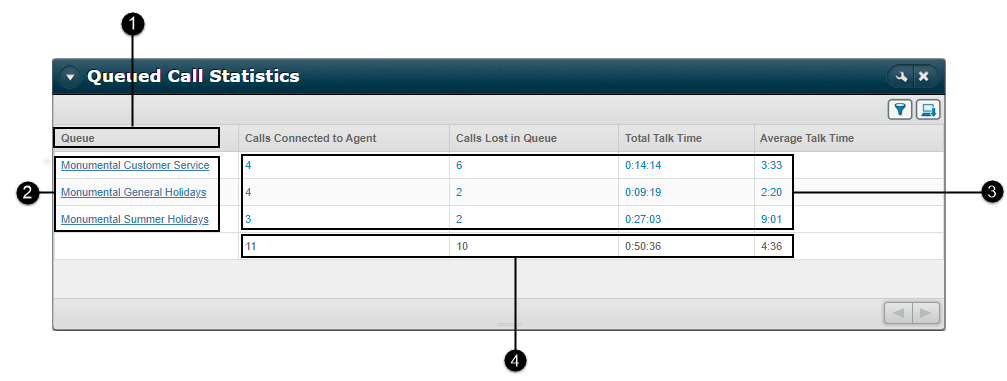
The metrics shown above are more meaningful if they are broken down by a discrete object such as Queue or Hour of Day. These are examples of dimensions.
Breaking down the report above by the 'Queue' dimension gives:
|
|
|
|
A dimension from same historical data source as the metric. |
|
Dimensional values for the date and time range in which the report is run. |
 |
Metric values broken down across each dimensional value. |
 |
Recalculated metric totals. |
A hyperlinked dimensional value indicates that the value is broken down on another dimension. In the example above, clicking the hyperlinked 'Monumental Customer Services' dimensional value gives:
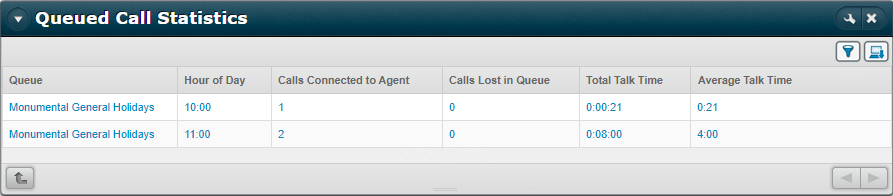
We see a breakdown of the three calls to the Monumental General Services queue by hour of day. Clicking ![]() returns you to the previous dimensional level. A report may be broken down on several dimensional levels. See also, Run Historical Reports.
returns you to the previous dimensional level. A report may be broken down on several dimensional levels. See also, Run Historical Reports.
A Dimension is Related to a Data Export Field
A dimension is related to a data export field in the same data source. For example, the Queue dimension in the CONTACT Actions data source is related to the Queue data export field in the CONTACT Actions data source.
To illustrate this, consider a series of five incoming interactions to three different queues. A data export report based on the Contact Actions data source and populated with the Queue data export field looks like this:
|
2019-07-16 10:42:01 |
Customer Service |
|
2019-07-16 10:54:30 |
General Holidays |
|
2019-07-16 11:00:43 |
General Holidays |
|
2019-07-16 11:09:18 |
General Holidays |
|
2019-07-16 11:32:25 |
Summer Holidays |
In a custom report generated over the same date and time period, the Queue dimension in the CONTACT Actions data source breaks down a Queued Call Count metric like this:
|
Queued Call Count |
|
|
Customer Service |
1 |
|
General Holidays |
3 |
|
Summer Holidays |
1 |
|
|
5 |
The Queue dimension in the custom report presents dimensional values that are same as the values in the data export report's Queue field.
Explore Further
Historical Data Export Reports
Filters in a Custom Historical Report
Effect of Adding a Dimension to a Custom Historical Report
Dimensions Reference (in the storm VIEW Historical Data Source Reference Guide)