Formula Metrics
Administrators only
A formula metric is for use in a custom report. VIEW provides three types of formula metric:
A percentage difference formula metric returns percentage values indicating how metric values changed across the user-selected date range and a corresponding earlier date range.
The percentage difference values that are returned by the metric can be of type delta or scalar. A metric of type delta measures changes from the earlier values whilst a metric of type scalar indicates the scale factors by which the values changed. The following table shows examples of how delta and scalar percentage difference values are calculated.
|
Example Value in selected range |
Example Value in earlier range |
Metric value (delta) |
Metric value (scalar) |
|
4 |
2 |
100% The value in the selected date range is a one hundred percent increase over the value in the earlier date range. |
200% The value in the selected date range is twice the value in the earlier range. |
|
2 |
4 |
-50% The value in the selected date range is a fifty percent decrease over the value in the earlier date range. |
50% The value in the selected date range is half the value in the earlier range. |
|
3 |
3 |
0% The value in the selected date range is neither an increase nor a decrease over the value in the earlier date range. |
100% The value in the selected date range is the same as the value in the earlier range. |
|
0 |
Any value |
-100% The value in the selected date range decreased by 100 per cent of the value in the earlier range and is now therefore 0. |
0% The value in the selected date range or the earlier range is 0. |
|
Any value |
0 |
0% It is not possible to calculate a delta percentage increase because the value in the earlier range is 0. |
0% The value in the selected date range or the earlier range is 0. |
The corresponding earlier date range can be any one of the following for a percentage difference metric:
|
Earlier date range option |
Description |
Example selected date range |
Earlier date range used in calculation |
|
Date range immediately preceding |
This uses the value calculated from the selected date range and divides it by the value calculated in the immediately preceding range of the same size. |
March 2019 Week 44, 2019 15 to 18 April 2019 |
February 2020 Week 43, 2019 11 and 14 April, 2019 |
|
Same date range last week |
This uses the value calculated from the selected days of the week and divides it by the value calculated for the same days of the preceding week. For the result to be meaningful, the selected date range must not be longer than a week. If the report is broken down on a date and time dimension, this must be less than a week (for example, 'Hour of Day' and '30 Minute Periods'). |
Wed to Fri in Week 44, 2019 |
Wed to Fri in Week 43, 2019 |
|
Same date range last month |
This uses the value calculated from the selected days of the month and divides it by the value calculated for the same days of the preceding month. For the result to be meaningful, the selected date range must not be longer than a month. |
15 to 18 April 2019 |
15 to 18 March 2019 |
Note: a week starts on a Monday.
Note: we recommend that you name the metric to include the period and type of difference it is measuring. This will help administrators and supervisors to run reports containing this metric over meaningful date ranges.
As an example of a percentage difference metric, let's say you wish compare the delta percentage difference of calls lost in queues on a weekly basis. To do this, you could create a metric named Calls Lost in Queue Weekly Delta % Diff, configuring it to be of type 'Delta' and selecting the 'Same Date Range Last Week' option. Shown below is a report containing this metric and run for Tuesday, Wednesday and Thursday of week 23 in a given year:
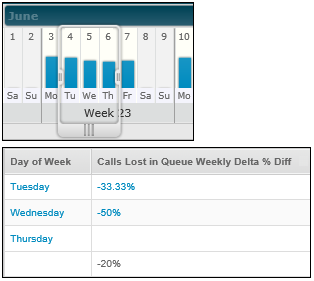
The percentage difference calculations show how the values for Tuesday to Thursday in week 23 have changed from the values measured on Tuesday to Thursday in week 22. A blank cell indicates that no data was recorded on either the selected Thursday, the previous Thursday, or both.
A past value formula takes the selected date range and simply returns a value from a corresponding earlier date range.
As an example of a past value metric, let's say you wish to retrieve values from an earlier period. To do this, you could create a metric named Calls Lost in Queue (preceding value), configuring it to use the 'Date Range Immediately Preceding' option. Then, by inserting this metric alongside a standard Calls Lost in Queue metric in a report, you can compare the selected period's values with those in the previous period as shown below.
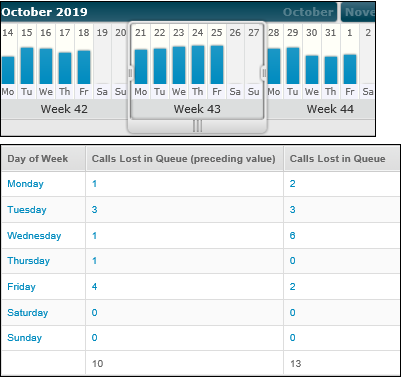
The values in the Calls Lost in Queue column are those for week 43, whereas those in the Calls Lost in Queue (preceding value) column are for week 42.
Note: the earlier date range choices are exactly the same as those for the Percentage Difference formula (above). Refer to that section for examples.
A custom formula metric calculates a value by performing an arithmetic calculation on existing count metrics, aggregate metrics, or both. You can use any of the arithmetic operators plus (+), subtract (-), multiply (*), and divide (/) in the formula. For example:
|
Formula metric |
Example formula containing count and aggregate metrics |
|
Total Calls |
Total Incoming Calls + Total Outgoing Calls |
|
Routed rate % |
Calls Connected to Agent / Queued Call Count |
|
Service Level % |
Connected to Agent with Service Level / (Calls Lost in Queue + Calls Connected to Agent - Calls Lost in Queue in 5-30s) |
|
Average Handling Duration |
(Total talk Duration + Total Hold Duration + Total Wrap Duration) / Total Incoming Calls |
You can use both standard and custom metrics in a formula metric. A formula metric may not contain other formula metrics.
Explore Further