Create a Dashboard for Real-Time Statistics
This is a procedural topic for administrators describing how to create a blank dashboard ready for populating with real-time statistics modules.
This topic also covers the related task Delete a Real-Time Statistics Dashboard.
Prerequisites
- You have logged in to storm with your user log in credentials and then launched the VIEW application. See Log in to storm and Launch VIEW.
- You are familiar with the VIEW Dashboard Interface.
Basic configuration
If no dashboards exist upon launching VIEW, a dialog prompting you to create your first dashboard is displayed. In this case, ignore the first two steps in the procedure below.
-
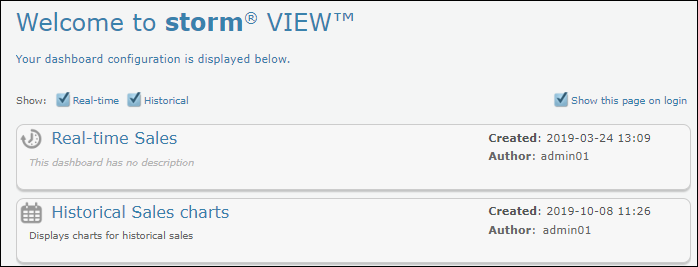
Navigate to the tabbed display of your dashboards by clicking
 on the button bar and then click any dashboard on the 'Welcome to storm VIEW' contents page:
-
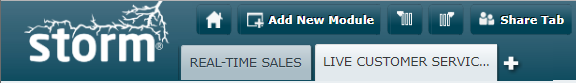
Click the Plus
 button located to the right of the last dashboard tab.
-
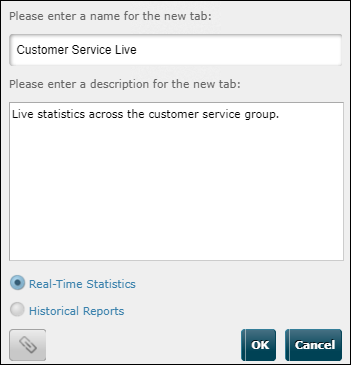
In the dashboard creation dialog, enter a meaningful name for the dashboard. Optionally, provide a description that summarises the type of reports that the dashboard is intended to display (this description will be displayed on the Contents page and as a tooltip when users hover over the dashboard tab).
-
Ensure that Real-time Statistics is selected and then click OK.
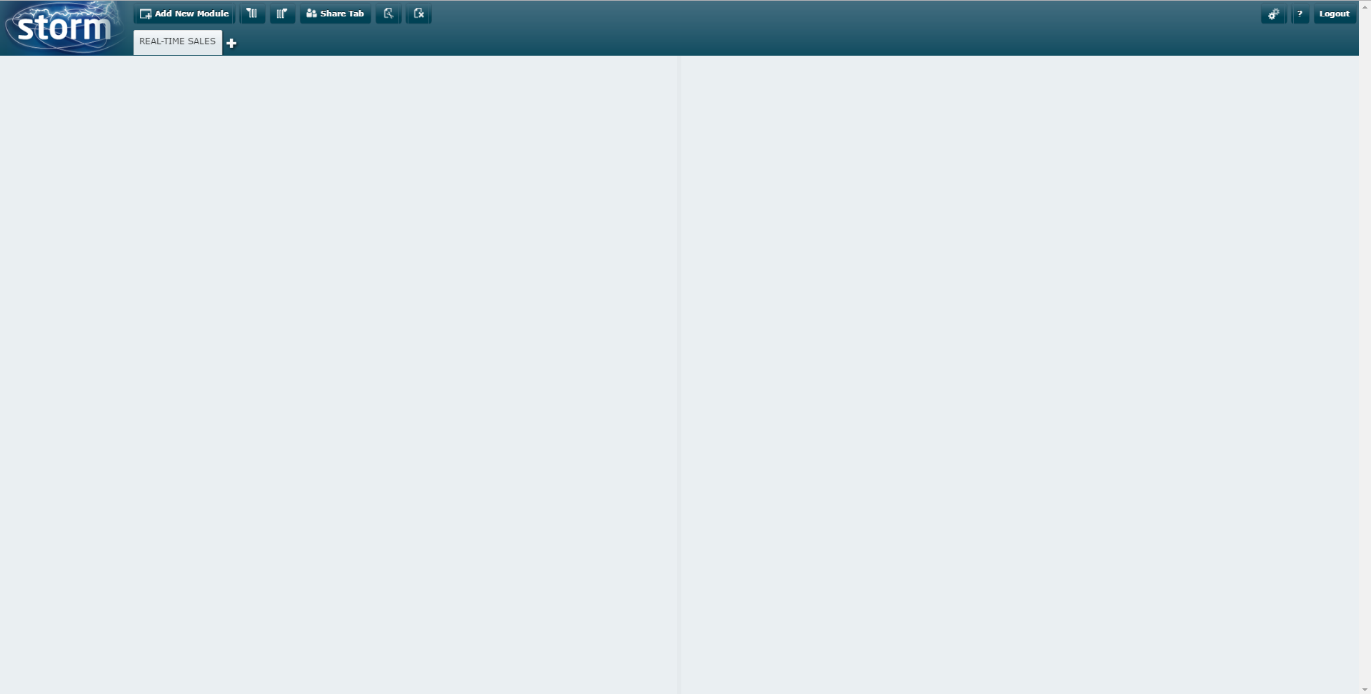
An empty real-time statistics dashboard is displayed. The dashboard space is presented as two columns divided by a light grey line. You can now set up real-time modules here. See Place Real-Time Modules on a Dashboard.
Hovering your mouse cursor over the tab displays the dashboard description (if provided) in a tooltip.
Related Task
Delete a Real-Time Statistics Dashboard
-
Select the dashboard and then click
 on the button bar.
 -
Read the delete confirmation and then click OK.
Explore Further