Configure a Real-Time Agent Group Module
This is a procedural topic for administrators describing how to configure a real-time Agent Group Module.
This topic also covers the following related tasks:
Hide the Summary Statistics Panel
Hide the Group Statistics panel
Hide Selected Events on the Group Statistics Panel
Hide the Individual User Statistics panel
Control Which Columns to Display in the Individual User Statistics Panel
Configure an Event's Value to Change Colour on Reaching Chosen Thresholds
Enable the Agent Group Module to be Resized Manually
Prerequisites
- You have logged in to storm with your user log in credentials and then launched the VIEW application. See Log in to storm and Launch VIEW.
- You are familiar with the VIEW Dashboard Interface.
- You have created a real-time dashboard. See Create a Dashboard for Real-Time Statistics.
- You know how to place real-time modules from the Module palette. See Place Real-Time Modules on a Dashboard.
- You are familiar with the meanings of the real-time statistics supported in the module. See Agent Group Module.
Basic Configuration
-
From the Module palette, drag and drop an Agent Group module onto an empty part of the dashboard.

-
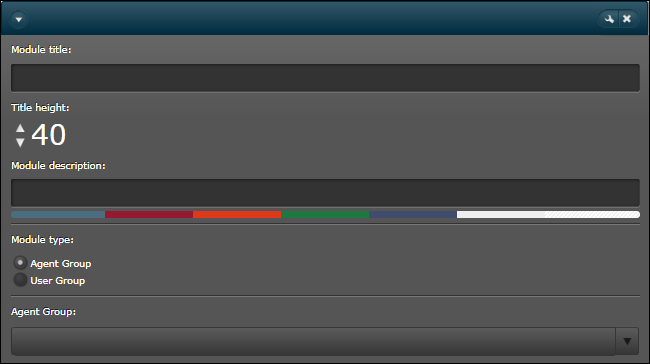
Click the
 button in the module's title bar to display the configuration options.
 -
If a module type option is provided, choose either 'Agent Group' or 'User Group'.
-
Select an agent or user group from the Agent Group or User Group options list, whichever is relevant. (This list can be restricted for supervisors by a storm UC/CONTACT administrator.)
-
If desired, change the height and colour of the module's title bar using the title height control and by clicking a colour on the colour bar.
-
Optionally, enter a meaningful description for the module. This will appear in a tooltip when a mouse cursor hovers over the module's title bar. The module title takes its name from the selected event but edit this if required.
-
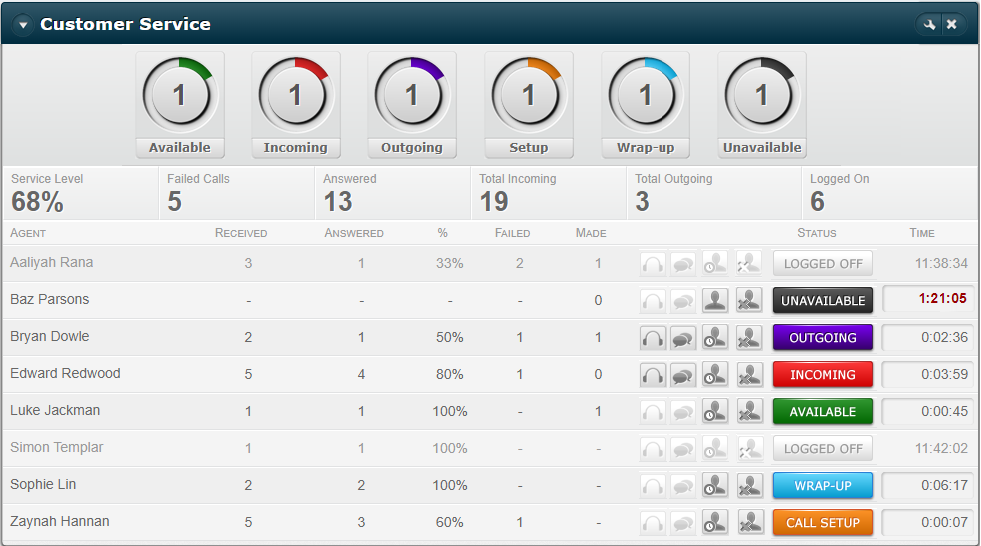
Click the module's Save button. The module updates with data for the selected agent or user group immediately. Shown below is a module that is configured to shown agent group statistics:
Related Tasks
Summary Statistics Panel
|
Task |
Procedure |
|
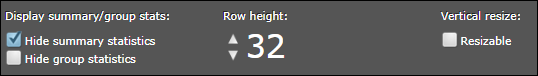
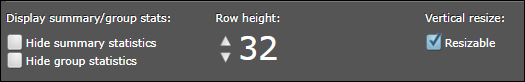
Select the 'Hide Summary Statistics' check box and then click Save.
|
Group Statistics Panel
|
Task |
Procedure |
|
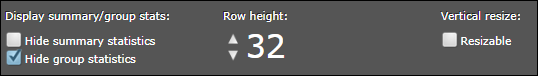
Select the 'Hide Group Statistics' check box and then click Save.
|
|
|
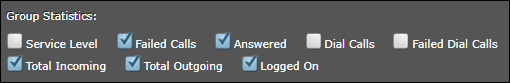
Select or clear the check boxes in the 'Group Statistics' section and then click Save.
The options are described in Agent Group module. |
Individual User Statistics Panel
|
Task |
Procedure |
||||||||||||||||||||||||||||||||||||||||||
|
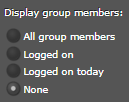
Select the 'None' option in the 'Display group members' section and then click Save. |
|||||||||||||||||||||||||||||||||||||||||||
|
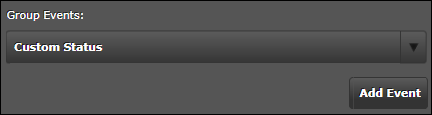
Select an event name from the 'Group Events' options list and then click Add Event.
The options are described in Agent Group module. Click Save. Click
Each event corresponds to a column name or button in the panel:
|
|||||||||||||||||||||||||||||||||||||||||||
|
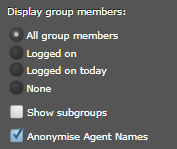
In the 'Display group members' section, select the 'Anonymise Agent Names' or 'Anonymise User Names' option and then click Save.
|
|||||||||||||||||||||||||||||||||||||||||||
|
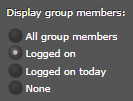
In the 'Display group members' section, select one of the following and then click Save.
|
|||||||||||||||||||||||||||||||||||||||||||
|
Configure an Event's Value to Change Colour on Reaching Chosen Thresholds |
Click the event's Alert button.
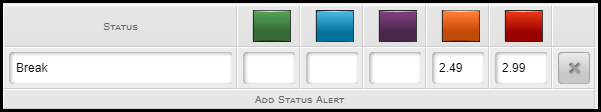
For Status and Custom Status durations:
Click Add Status Alert and then type the exact name of a status in the Status column (this is not case-sensitive). Then, type threshold value limits (in minutes) next to some or all of the colours, which when exceeded, will display the status duration in those colours. For example, with the settings shown, the duration for Break will display in orange at 2 minutes and 30 seconds, and in red at 3 minutes. Repeat this for other statuses as required. |
||||||||||||||||||||||||||||||||||||||||||
|
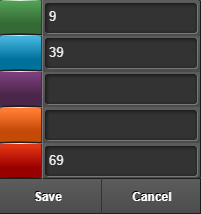
For other events, type threshold value limits next to some or all of the colours, which when exceeded will display the value in those colours.
For example, with the settings shown above, a value will display in green at 10, in blue at 40, and in red at 70. |
 to remove an event.

General Tasks
|
Task |
Procedure |
|
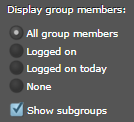
This is available in an 'agent group' configured module and applies to an agent group that contains other agent groups.
In the 'Display group members' section, select the 'Show subgroups' check box and then click Save. |
|
|
In the 'Display summary/group stats' section, select the 'Resizable' check box and then click Save.
You can then resize the module by clicking and dragging its bottom edge. |
Equivalent Historical Statistics
Use this section if you want to present historical statistics that are close or equivalent to the real-time statistics supported in the Agent Group module when it is in an 'agent group' configuration.
In the following tables, the Statistic column is the statistic name as seen in the Agent Group module. The second column displays the equivalent historical statistic and, where relevant, the standard historical report where the statistic is available.
For detailed descriptions of these historical statistics, see the storm VIEW Standard Historical Reports Reference Guide or the storm VIEW Historical Data Source Reference Guide.
Group Statistics
|
Statistic |
Equivalent standard historical statistic |
|
Service Level |
Service Level metric. Use the standard Agent Groups report. |
|
Failed Calls |
Failed Calls metric. Use the standard Agent Groups report. |
|
Answered |
Answered Communications metric. Use the standard Agent Groups report. |
|
Total Incoming |
Incoming Communication Attempts metric. Use the standard Agent Groups report. |
|
Total Outgoing |
Outgoing Calls (Manual) metric |
Individual User Statistics
|
Column |
Equivalent standard historical statistic |
|
Agent |
Agent dimension. Use the standard Agent Groups report. |
|
Received |
Incoming Communication Attempts metric. Use the standard Agent Groups report. |
|
Answered |
Answered Communications metric. Use the standard Agent Groups report. |
|
% |
Service Level metric. Use the standard Agent Groups report. |
|
Failed |
Failed Calls metric. Use the standard Agent Groups report. |
|
Made |
Outgoing Calls (Manual) metric |
Explore Further