Configure a Real-Time Pie Chart Module
This is a procedural topic for administrators describing how to configure a real-time Pie Chart Module.
This topic also covers the following related tasks:
Remove an Event from a Pie Chart
Change an Event's Measurement Type
Prerequisites
- You have logged in to storm with your user log in credentials and then launched the VIEW application. See Log in to storm and Launch VIEW.
- You are familiar with the VIEW Dashboard Interface.
- You have created a real-time dashboard. See Create a Dashboard for Real-Time Statistics.
- You know how to place real-time modules from the Module palette. See Place Real-Time Modules on a Dashboard.
Basic Configuration
-
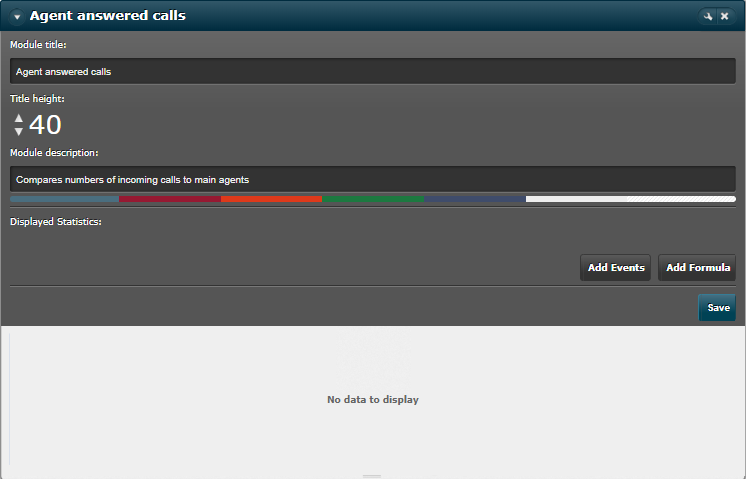
From the Module palette, drag and drop a Pie Chart module onto an empty part of the dashboard.

-
Click the
 button in the module's title bar to display the configuration options.
 -
Enter a meaningful name and description for the pie chart. The description will appear in a tooltip when a mouse cursor hovers over the module's title bar.
-
If desired, change the height and colour of the module's title bar using the title height control and by clicking a colour on the colour bar.
-
Click Add Events to add a set of real-time events where each event will be represented by bar on the chart. A dialog displays a categorised list of entities configured in your contact centre.
-
Use the dialog's controls to select the desired events and then click OK at the bottom of the dialog.
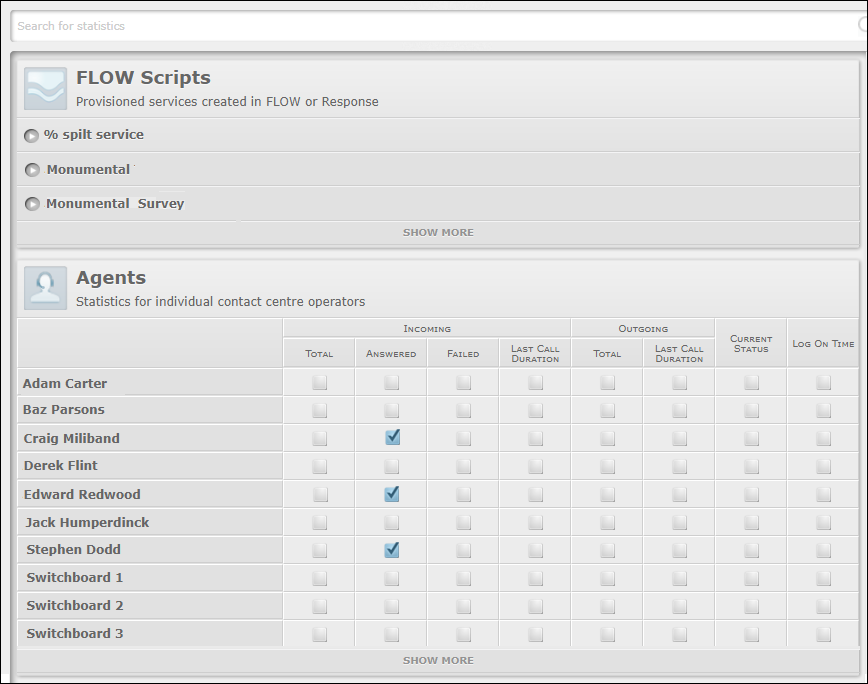
Note: at the bottom of each category of events, click the Show More link to show more entities as necessary. To quickly search for an entity or an event, type its name in the filter field at the top of the dialog.
For a complete list and descriptions of all events available in this dialog, see Real-Time Events Selector.
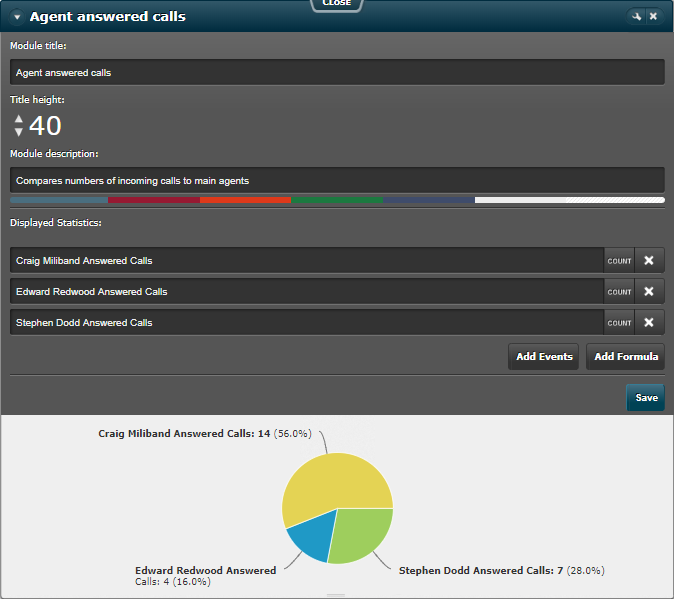
The chart updates with data for the selected real-time events immediately:
-
Click the module's Save button.
Related Tasks
|
Task |
Procedure |
||||||||||||
|
Click the event's |
|||||||||||||
|
Edit the event name directly and then click Save.
|
|||||||||||||
|
Click the Count button and then select another type of statistic to display for the event. You Ensure that the selected type is meaningful for the event.
Note: if you select another measurement type, ensure that you edit the name of the module to reflect the new behaviour. For example, if your module includes the '<Queue> Current Queue Length' real-time event, and you change its type to 'Maximum Value', you might edit its name to include the phrase 'Maximum Queue Length'. Changing an event's name is described in Change an Event Name, above. |
 button.
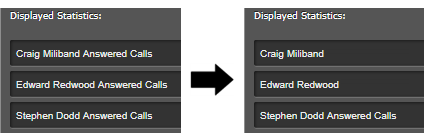
Explore Further