Voice Queues
This report displays incoming calls to all ACD ('intelligent') queues in a tabular format. It allows you to check on historical queue performance and displays statistics similar to those shown in a real-time agent Queues module such as queued call counts and calls routed from queues. You can filter the dashboard report to show statistics for particular queues.
Ex.png)
Note: not all columns are shown (see below for full details).
Basic Information
|
Category |
Queue |
|
Custom or data export |
Custom |
|
Channels |
|
|
Historical Data Source |
CONTACT Actions |
|
Supported formats |
|
|
|


Dimensions and Metrics
The report is broken down by the Queue, Date, and 30 Minute Periods (Continuous) dimensions. The following metrics are displayed for each queue, or for the 30-minute periods of the day on a selected date for a selected queue.
|
Metric |
Description |
|
Queued Call Count |
The total number of voice calls that entered a queue. A call is counted more than once if it routed to more than one queue. For example, a caller who entered a queue and was subsequently transferred or overflowed to another queue results in a count of '2'. |
|
Queued Calls Connected |
The number of queued calls that were connected to agents. |
|
Avg Speed to Answer |
The average duration for which an answered contact waited in a queue. For callbacks, the calculation takes into account the duration measured from the point when each contact entered a queue to the point when they were connected to an agent. The queue wait time for a call that waited in an unserviced overflow queue is excluded even though the call may ultimately have been answered by an external party. Measured in the unit of seconds. |
|
Queued Calls Connected Inside SLA |
The number of calls that entered a queue and were connected to an agent within the service level threshold assigned to the queue. |
|
% Queued Calls Connected Inside SLA |
The number of calls that entered queues and were connected to agents within the service level thresholds assigned to those queues as a percentage of all calls that entered queues and were connected to agents. It is the ratio of the metrics Queued Calls Connected Inside SLA and Queued Calls Connected. |
|
Calls Lost in Queue |
The number of queued callers who hung up without being connected to an agent, or who overflowed to another queue, or who were taken out of a queue after having been sent to it during an agent-initiated warm transfer attempt that was not completed. |
|
Calls Lost in Queue (5-30s) |
The number of queued callers who hung up after waiting in a queue for between 5 and 30 seconds. |
|
Avg Call Abandon Duration |
The average time taken for a caller to abandon a call whilst waiting in a queue. Measured in the unit of seconds. |
|
Longest Wait Duration (Answered Calls) |
The longest duration for which an answered call had to wait in a single queue. For an incoming call in which a caller requested a callback, this duration excludes the queue wait duration that had elapsed before the callback request was made. The queue wait time for a call that waited in an unserviced overflow queue is excluded even though the call may ultimately have been answered by an external party. In MM:SS |
|
Longest Wait Duration (Unanswered Calls) |
The longest duration for which an unanswered call had to wait in a single queue. In MM:SS |
|
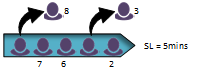
The number of calls that were answered within queue service level durations as a percentage of the total answered calls routed from the queues. This is calculated as: A / (B + C - D) where: A = Queued Calls Connected Inside SLA B = Queued Calls Connected C = Calls Lost in Queue D = Calls Lost in Queue (5-30s) To illustrate this, consider an example in which the service level is 5 minutes and there are 5 queued callers.
The first caller connects to an agent after 2 minutes; the second caller ends their call after 3 minutes whilst still queueing; the third and fourth callers connect to agents after 6 and 7 minutes respectively; and the fifth caller ends their call after 8 minutes whilst still queueing. From this: Queued Calls Connected Inside SLA = 1 (caller 1) Queued Calls Connected = 3 (callers 1, 3, and 4) Calls Lost in Queue = 2 (callers 2 and 5) Calls Lost in Queue (5-30s) = 1 (caller 2). This gives a % SLA value of 1/(3+2-1) = 25%. In the calculation, calls lost in the queue within the service level period are excluded from the calculation because it is not known whether they would have been connected to an agent within that period. |
|
|
% Routed Rate |
The proportion of calls routed to agents as a percentage of total calls that entered queues. |
|
% Lost Rate |
The proportion of calls lost in queues as a percentage of total queued calls. |
|
Avg Talk Duration |
The average time an agent spent talking to a caller who had been routed through a queue. In MM:SS |
|
Avg Hold Duration |
The average time for which a caller who had been routed through a queue was put on hold by an agent. In MM:SS |
|
Avg Wrap Duration |
The average time an agent spent in the 'wrap-up' status. In MM:SS |
|
The average time an agent spent handling a call. This includes talk, hold, and wrap-up. Note: the reported value is not necessarily the sum of the Avg Talk Duration, Avg Hold Duration, and Avg Wrap Duration metrics. See also, Calculation of Average Call Handling Duration. In MM:SS |
|
|
Total Talk Duration |
The total duration agents spent talking to callers who had been routed through a queue. In HH:MM:SS |
|
Total Wrap Duration |
The total duration agents spent in the 'wrap-up' status. In HH:MM:SS |
Report Filters
|
Filter |
Setting |
Configurable on dashboard? |
|
Queue |
Includes statistics for all queues. |
Yes. Use the filter to include or exclude individual queues. |
For instructions on applying filters to a dashboard report, see Filter a Historical Report'.