Line Chart Module

Displays a single real-time event over the previous 15-minute rolling period.
The event is selected by an administrator. Consult the administrator if you require more information about it.
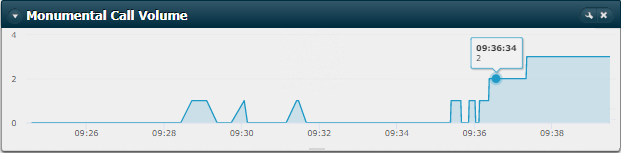
The time axis along the bottom of the chart scrolls to shows the rolling summary. As the event's value changes over time, the vertical scale on the right of the chart adjusts automatically. Hovering your mouse pointer over any point on the line reveals a pop-up display showing the time and the value recorded at that time.
See Configure a Real-Time Line Chart Module (administrators only).