Configure Personal Queue Statistics for Agents
Personal queue statistics refers to a panel that is available for agents to see in DTA.

You can choose the statistics that should display for different queues and queue groups and then assign these to an agent group. Only agents in these agent groups can see those statistics.
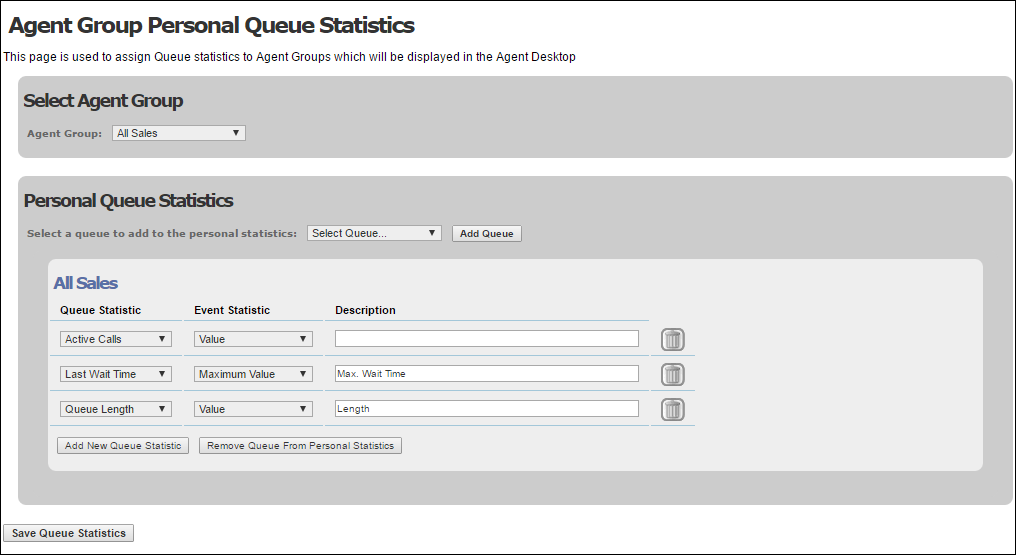
- Select storm Contact > Agent Groups > Personal Queue Statistics.
- Select the target agent group.

- On the Personal Queue Statistics panel, select a queue or queue group (queue group names are followed by an asterisk, to differentiate them from queues) and then click Add Queue.
- Click Add New Queue Statistic and then select a queue or queue and event statistic from the options list. Enter a meaningful description to display to agents.
|
Queue statistic |
Display in DTA |
Suggested event statistic |
|
Active Calls |
Number of active calls in the queue |
Value |
|
Available Agents |
Number of available agents in the group |
Value |
|
Current Wait Time |
Wait time (hh:mm:ss) for the contact at the front of the queue |
Value |
|
Entered |
Number of contacts who entered the queue today |
Number of Updates |
|
Last Routed |
Time of last routed contact to an agent |
Value |
|
Last Wait Time |
Wait time for most recent contact who spoke to an agent |
Value |
|
Lost |
Number of contacts who hung up whilst waiting in the queue |
Number of Updates |
|
Lost in S.L. |
Number of waiting contacts who hung up within the queue's service level threshold period (default is 20 seconds) |
Number of Updates. |
|
Queue Length |
Number of queued contacts |
Value |
|
Routed |
Number of contacts routed to an agent |
Number of Updates |
|
Routed in S.L. |
Number of contacts routed to an agent within the queue's service level threshold period (default is 20 seconds) |
Number of Updates |
- Add further statistics to the queue by clicking Add New Queue Statistic.
- Click Save Queue Statistics.
Notes: statistics reset at midnight (GMT).
If queue statistics are configured for a queue for different agent groups, an agent belonging to both agent groups will see one set of queue statistics which includes statistics from each configuration. If the same statistic is included in each agent group but different descriptions are used, the description displayed is the last alphabetic description for that statistic.